See the load
Cameras give a picture of vehicle traffic. The overview helps check how the load is spread and where queues form at the pumps.

Video analytics for fuel stations. Vehicle flow, queues, checkout activity and on-site events in one interface.
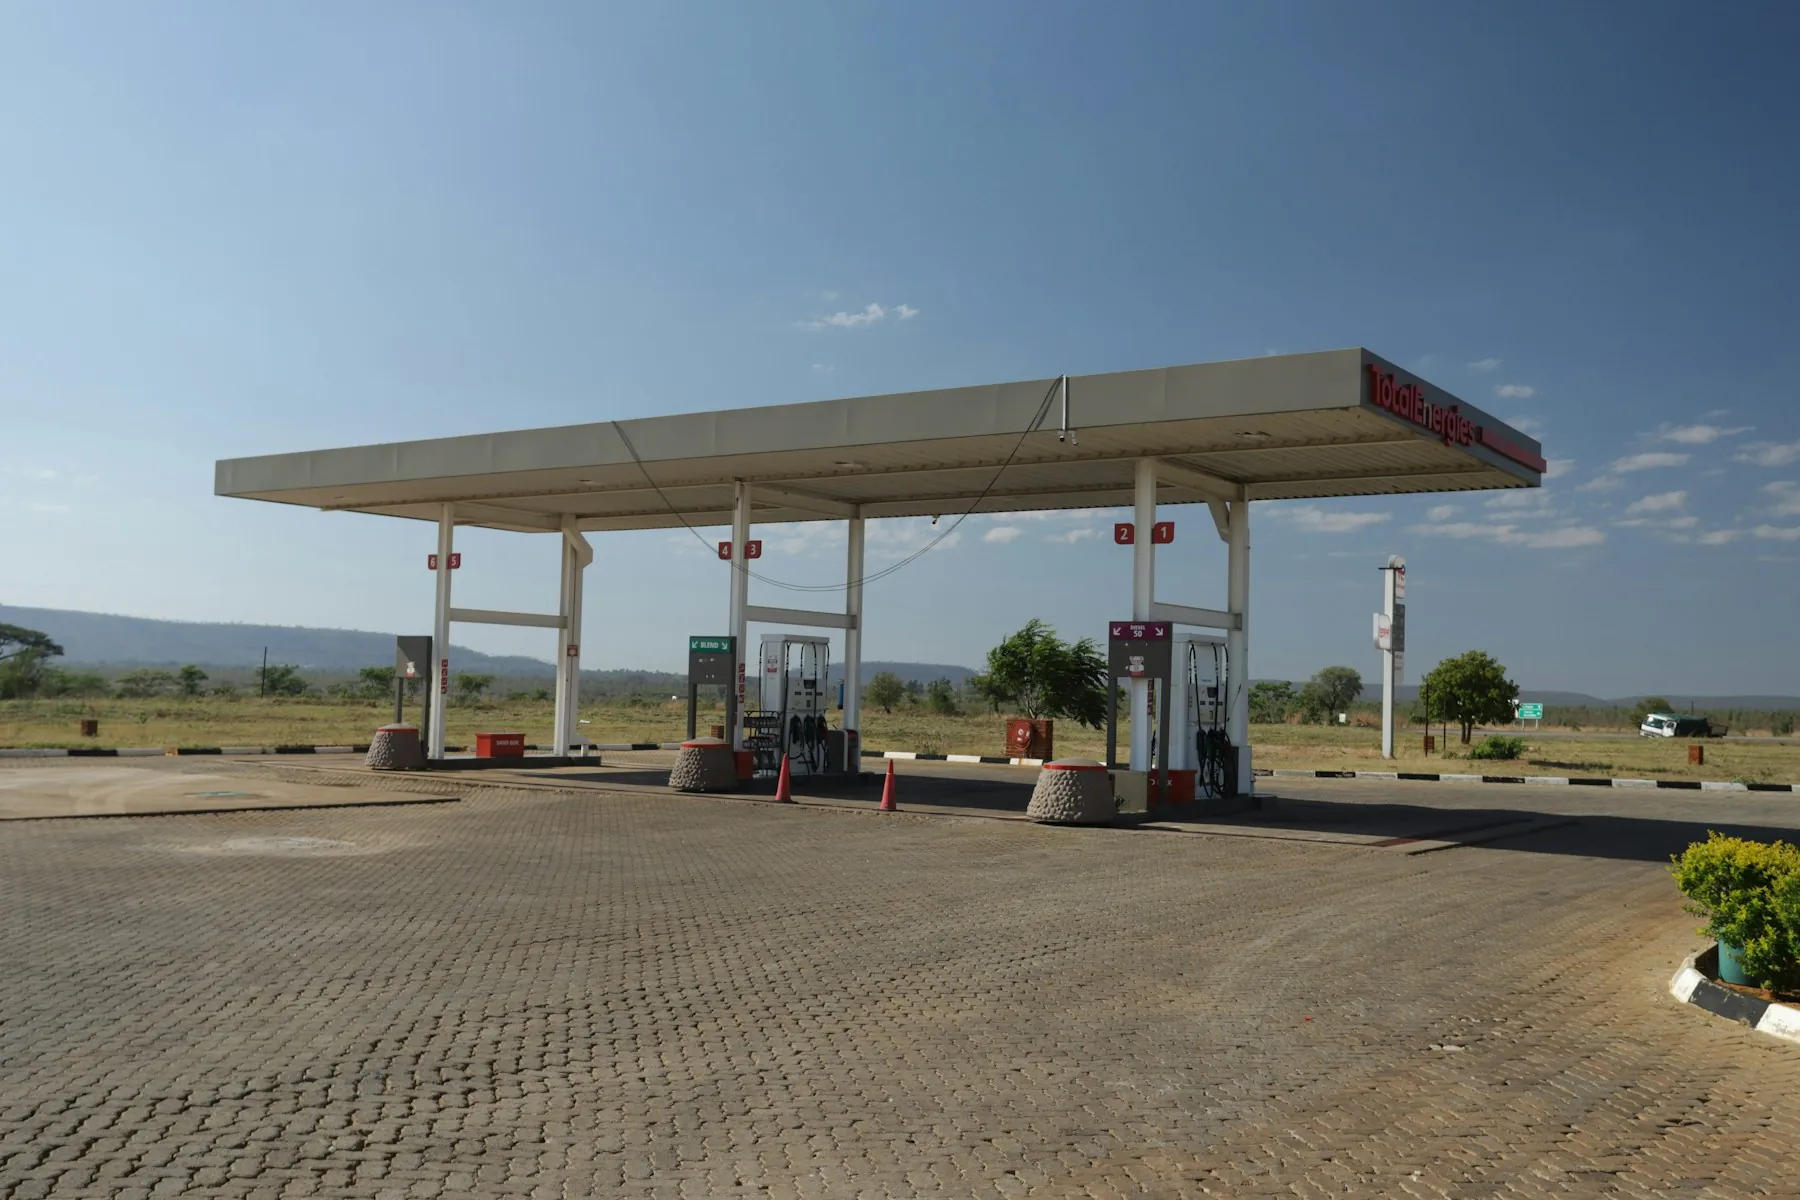
At a fuel station, vehicles move, pumps run and customers are served all at once. Kepler Vision brings camera signals together so the shift can keep an eye on the forecourt more easily.
The system flags an episode and shows the frame and context. An operator reviews it and acts according to station rules. We agree on the scenario set and monitored zones before launch.
Five working scenarios in the Kepler Vision interface. Choose a tab and open a frame to see the details.
What the system sees. The entry camera captures vehicles. In the interface, you can pick a period and view visit counts, unique vehicles and the hourly distribution of traffic.
How the team uses it. The manager compares peak hours and goes back to visit history. License plates are hidden in the published example; access rights to the working log are agreed separately.
How an event is created. A monitoring area is set for the checkout zone. The event card shows frames from the episode, its start and end, and how long the absence lasted.
What the shift supervisor checks. Compares the event with the schedule, breaks and what is happening at the checkout. The screenshot shows a 30-minute episode; actual trigger conditions are agreed for each station.
What the detector highlights. The image marks an area with a possible sign of smoke. The card shows the event type, camera and detection time.
Next step. The person in charge assesses the frame and checks the situation on site according to station procedures. The label does not automatically confirm a fire — a person determines the source of the smoke and the context.
What goes into the log. The camera covers the agreed post zone. The example shows an episode of prolonged sitting, with a detection box and start and end times.
How the event is used. The supervisor checks the post conditions and the staff member’s duties. It is a reason to clarify the situation, not an automatic performance rating.
One screen for the shift. Cards show the load on six pumps, checkout staffing, and customer and vehicle flow. Recent events are listed below.
From overview to detail. The operator sees where a queue or event has appeared, then opens the relevant zone and checks the frame. Figures in the screenshot reflect the moment it was taken.
Frames from project materials. Faces and identifying details are anonymized; these are examples of the interface and detection, not a live feed.
Cameras give a picture of vehicle traffic. The overview helps check how the load is spread and where queues form at the pumps.
Selected scenarios flag an event, such as a cashier away from the checkout. Frames and duration stay in the card.
A staff member opens the event, contacts the relevant zone and acts according to station procedures.
The manager sees the load, the shift supervisor checks checkouts and events, and the IT team handles cameras and access.
Compares hourly visits and assesses pump load. The overall summary helps decide which zone and period to look at more closely.
Keeps an eye on checkout areas, opens event cards and checks the circumstances with shift staff.
Check camera angles at the entry, at the pumps and inside the store. Define video storage and access to license plates and events.
Select a zone on the map. Each has its own angle, scenario and review procedure.
The project interface shows vehicle flow analytics, checkout status, pump load and the event log.
For similar fuel stations, we start with a zone map: entry, fueling island, store and checkout line. Connecting a barrier gate or other devices is discussed separately after an equipment check.
We check the entry, license plates, pump coverage and checkout areas, accounting for headlight glare, night conditions and store lighting.
We agree on the checkout and security post areas, event conditions and what the pump summary includes.
Together we check vehicle passes, queues and events, and walk through event cards with the manager and shift supervisor.
We fine-tune settings when checkouts, cameras, operating hours or the site layout change.
About cameras, scenarios and launching the system at your site.
Ask your question ↗First, we check video streams, angles, lighting and image quality. After the survey, we determine which scenarios are available at your station.
They are figures from project interface snapshots for a selected period. They illustrate how the system works and are not current statistics or a promise of results.
No. The detector flags a possible sign of smoke. A staff member checks the frame and the situation on site according to established procedures.
Integration depends on the controller, cameras and entry rules. Compatibility and equipment behavior are agreed separately.
By the number of cameras and stations, the chosen scenarios, server infrastructure and support. We’ll prepare a proposal after discussing your needs.
We agree on the processing architecture, retention periods and access rights with your IT team before launch.
Tell us how many stations, entries and pumps you have. We’ll discuss checkout areas, cameras and the events your shift needs.